My first package published on CRAN - DepthProc recently hit 20k downloads.
library(cranlogs)
library(ggplot2)
downloads <-
cran_downloads("DepthProc", from = "2014-08-21", to = "2018-06-10")

ggplot(downloads) +
  geom_line(aes(x = date, y = cumsum(count))) +
  ylab("Downloads") + xlab("Date") + theme_bw() +
  ggtitle("DepthProc", "Download stats")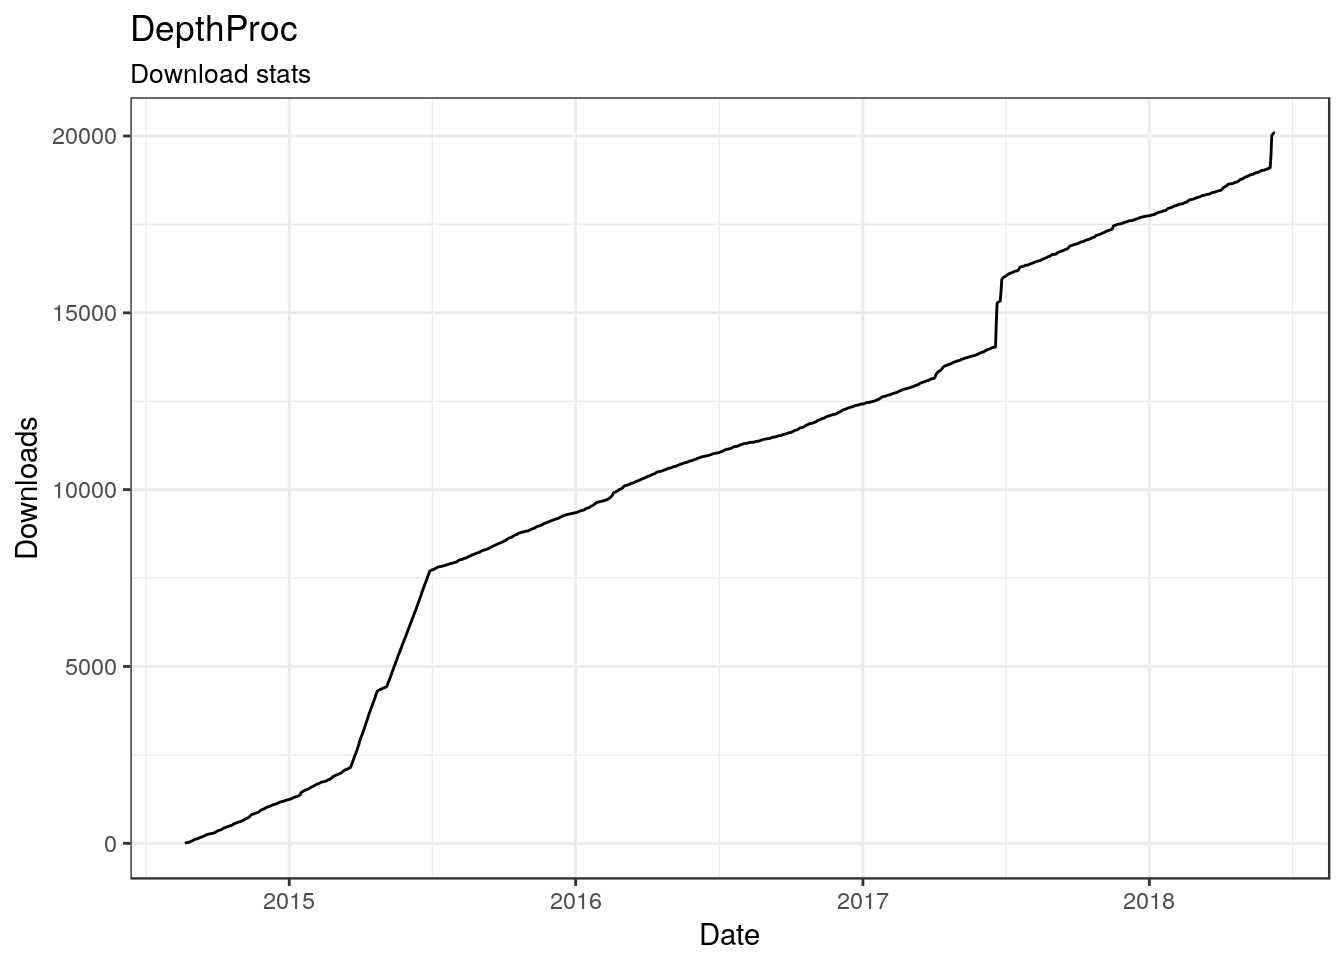
There are some jumps on the line. I wondered if they all occurred just after the package release (old users updates to the new versions). Here’s some code to check this.
library(rvest)
library(lubridate)
library(dplyr)
path <- "https://cran.r-project.org/src/contrib/Archive/DepthProc/"

versionDate <- html_table(read_html(path))[[1]]
versionDate <- versionDate[,c(2,3)]
versionDate <- versionDate %>%
  filter(grepl(Name, pattern = "DepthProc")) %>%
  mutate(Date = ymd(substring(`Last modified`, 1, 10))) %>%
  select(Date)

versionDate <- bind_rows(versionDate,
        data_frame(Date = ymd("2018-06-05"))) # Add current release
versionDate
## Date
## 1 2014-08-26
## 2 2014-11-10
## 3 2014-11-11
## 4 2016-02-12
## 5 2014-08-20
## 6 2017-06-20
## 7 2017-06-26
## 8 2018-06-05ggplot() +
geom_line(data = downloads, aes(x = date, y = cumsum(count))) +
ylab("Downloads") + xlab("Date") + theme_bw() +
ggtitle("DepthProc", "Download stats (vertical bars indicates new versions)") +
geom_vline(data = versionDate,
aes(xintercept = Date), color = "darkgreen", linetype = "dashed")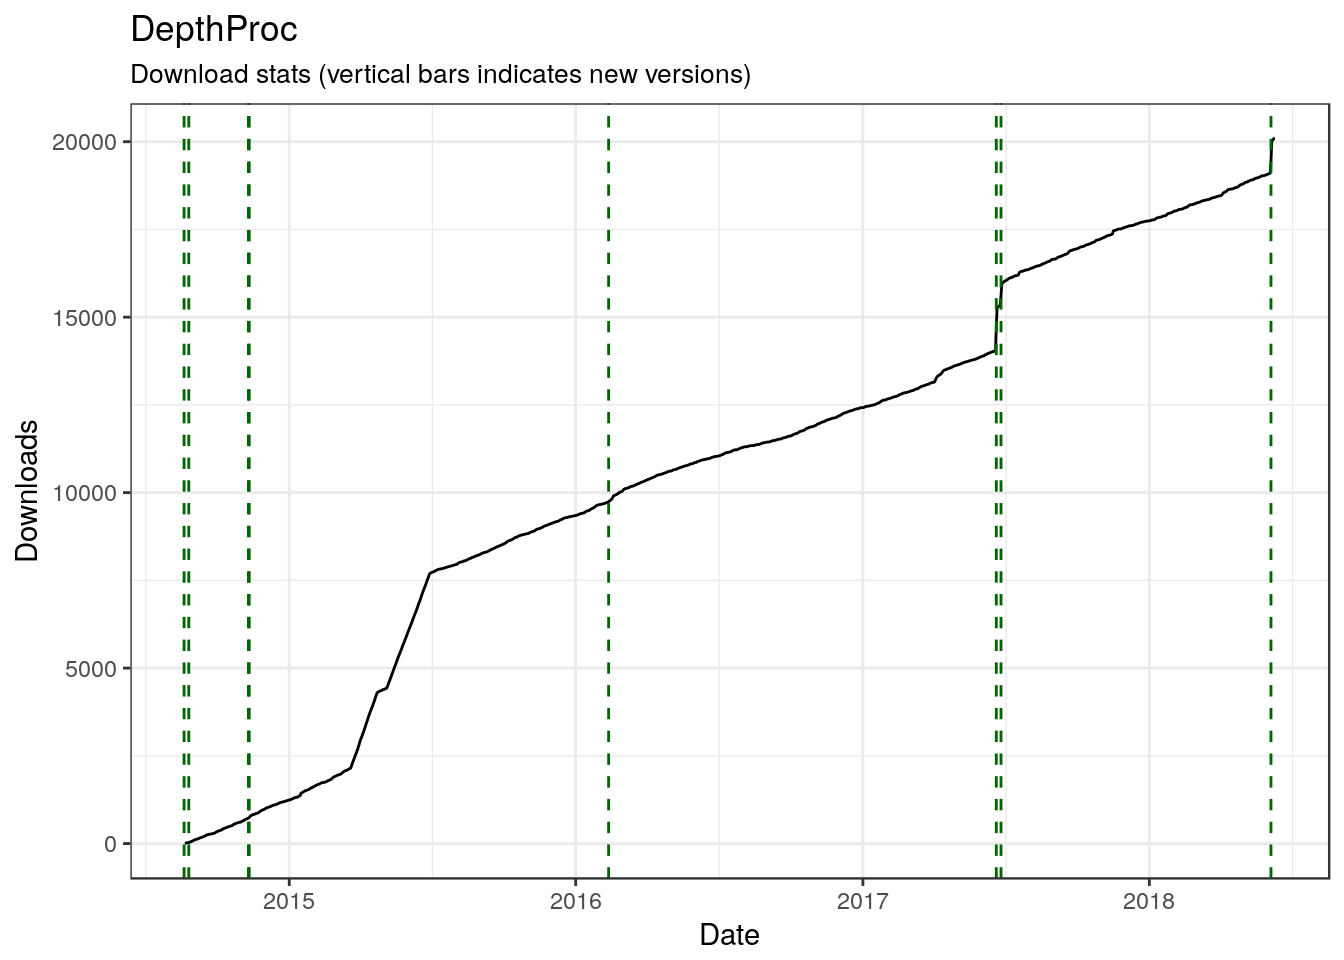
It seems that the main jump was related to something else. Anyway, it’s good to see that people use your work:)
If you have any questions about the package please send me an email or post an issue on the package’s GitHub page (https://github.com/zzawadz/DepthProc/issues).
Useful links:
- https://www.depthproc.zstat.pl/ - the package website (built with
pkgdown). - https://arxiv.org/abs/1408.4542 - description of the package’s capabilities.